
So, where does the circular economy begin? It’s an odd question I know, but I think that I’ve found an answer (well, sort of).
Within a loop, it always appears that removing one piece breaks the circle completely. That means that, in an ideal world, all actors within the system should be adopting circular economy practices simultaneously. Looking around, it often seems that this is exactly what is being attempted; small scale projects that address one of the system variables. Sadly, many seem to be doing so in isolation, which defeats the object.
My straw man of a systems map shows 41 variables and 62 systems dynamics that link them together into a network of influencers and dependencies. In a systems thinking approach, the next step is to identify intervention points – those pivotal places within the system that can be acted upon to create solutions that deliver.

Staring at a systems maps can often make problems seem even more complex and daunting than they did before, but we keep doing it because we know that buried deep in that tangle of lines and arrows, there must be a button to press. Sadly, there’s rarely a single button to press but what we do see is that some variables might have more influence than others. Looking at the systems map, it becomes clear that there are a number of causal loops at work, both balancing and reinforcing. In the balancing loops, we can also see that some of the means of correction have themselves a number of dependencies on other loops.
So, which nodes on the map are the initial drivers of change and which are outcomes that then drive system-wide changes?
A box of delights
MICMAC (Matrix-based Multiplication Applied to a Classification), is a tool developed by Michel Godet and was applied to France’s nuclear energy programme of the 1970s. As a result, it is said that France identified and forecast issues with the programme more than 30 years before they happened. Which I find impressive and disturbing in equal measure.
Anyway, MICMAC analyses nodes and their system dynamics to score each according to their ‘influence’ and ‘dependence’ (or as Kumu describe it in their tool ‘influence and exposure’). Influence describes the extent to which a variable has a direct causal effect and dependence describes the extent to which the variable is a result of other factors. I personally prefer the terms driver and driven. As you’ll appreciate, very few nodes are ever purely one or the other.
The scores can then be plotted on X&Y axes to create that thing beloved of all consultants, a two-dimensional matrix. In my use of MICMAC, the axes are defined as drivers and driven. Each node is then characterised according to its position on the matrix.
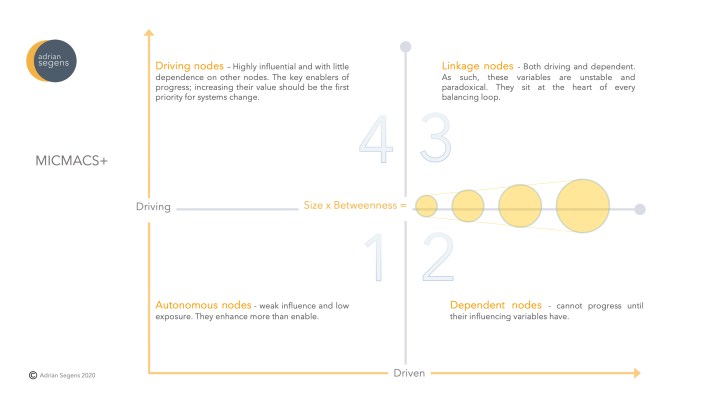
As a result, a MICMAC chart is created with 4 boxes:
1) Autonomous nodes
Autonomous nodes have little influence on the system’s dynamic. Neither are they the important outcomes but that doesn’t mean that they are unimportant or irrelevant. It does mean that their development can be carried on independently of their place in the dynamic of the system and that they are usually factors that enhance system performance rather than enable or define it. So, it’s probable that their driving power will grow over time.
2) Dependent nodes
The dependent nodes are are not influential but very dependent. They are the results of the impacts coming from other variables, principally those in boxes 3 & 4…
3) Linkage nodes
Linkage nodes are both highly influential and highly dependent. Any increase change in these variables will cascade throughout the rest of the system, profoundly affecting the system’s dynamic. But, there are preconditions that must exist before they gain the momentum to create systemic change. They cannot be initiated in and of themselves; they require situations to be created before they can function.
4) Driving nodes
Finally, driving nodes are the input stage. These are the variables that kick-off systemic change by creating the conditions that the linkage nodes require to drive the defining desired outcomes. These are the variables that need action as first priority.
MICMAC+
On top of these 4 boxes, I find it useful to create a bubble chart too, using 2 metrics that come from social network analysis – ‘Betweenness’ and ‘Size’. Hence MICMAC PLUS.
‘Betweenness’ analyses a systems map to see how many times a node lies on the shortest path between two others. In general, elements with ‘high betweenness’ have more control over the flow of data and act as the vital bridges within the system. It’s important to identify them as they can be the most effective intervention points or, potentially, be single points of failure that block everything else.
‘Size’ is a count of the number of immediate neighbours a node has.
So, by weighting size and betweenness in the chart, we get a clearer visualisation of just how critical each node is in making change happen.
Cut to the chase!
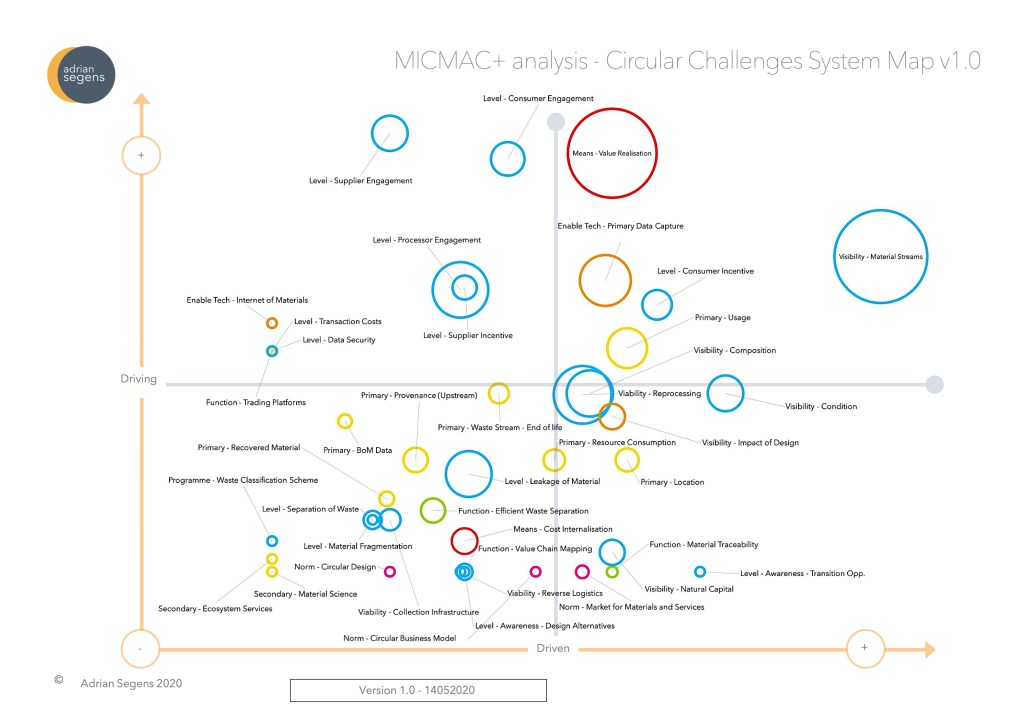
At last, we can see what’s in the all important box 4. What are the driving nodes of the circular economy and what are the ways in which technology can support intervention?
My initial reaction was surprise, followed by doubt. I went back to the systems map, checked my inputs and the way in which I’d exported them into a spreadsheet. Then I deleted all the connections and started again only to find the results were virtually identical. I suppose this is to be expected as what we see here is the result of my subjective view of the variables and the connections. Nevertheless, these were not the results that I had anticipated and it has made me re-evaluate my ideas.
Lesson number 1 – the lack of technology isn’t the issue
We need to be reminded that what we think of as the ways in which data technologies can enable and progress the circular economy is not the starting point. Of the 8 nodes in the ‘Driving’ box, 7 relate directly to the levels of engagement of the key actors (consumers, producers and processors) and what concerns and motivates them. In other words, we already seem to be losing sight of the customers, their needs and motives. After all, it is they that will drive the circular economy and they will only do so when they see the benefits.
I find box 1, the ‘Autonomous’ nodes really interesting. It is by far the most crowded; meaning that 17 of the 41 nodes have little driving force, neither are they immediately critical to progress, and yet it is here that we see the bulk of the data capture, analysis and processing functions. Notice too that the ‘size’ and ‘betweenness’ ratings of these nodes are so small as to produce very few significant bubbles.
I find this particularly sobering as it is these kinds of data capture issues that I have spent much of the past decade working on. It also explains much of what my experience has been in bringing such solutions to market.
Whilst there is a clear rationale for using these technologies (nobody doubts that they are necessary and valuable for the future), there is no compelling need for the majority of consumers, producers and processors to invest immediately.
The value proposition for the technology providers in all of these autonomous activities is that without them it is impossible to achieve the mega bubble that sits at the far right of the ‘Linkage nodes’ box. The visibility of material streams is clearly the most critical part of the system but its importance derives from its even larger neighbour – Means of Value Realisation.
As with many things in life, what should be so obvious that it does not need to be stated, does, in reality, need to stated again and again. LOUDLY.
Here we see why these Linkage nodes are described as ‘unstable’ and ‘paradoxical’.
Giving actors a means to realise the value of ‘waste’ requires that they can, a) see the waste / material streams and b) trade them. This is a great incentive but to know whether it is worth doing so, they will have to engage and invest in ways to capture and share various forms of data as efficiently as possible. Which is OK because they can be sure of recouping that investment… some day. So, we have an example of what was described by the WEF paper discussed in the first of these posts as ‘linear lock-in’.
The tech elements of the driving box are interesting. ‘Enable Tech – Internet of Materials’ earns its place in that upper left box by virtue of the three connected preconditions that sit just below it. 2 of these 3 must be urgently addressed by the tech community not because they have motivating power but because they are the opposite, they are key negative influencers that de-motivate engagement. Before progress can be made, it’s vital that trade in data and materials can be conducted at near zero cost and that actors are willing to confidently share data. This is clearly a job for Blockchain but more of that later.
Then we can look at the next challenge – how can actors be motivated to share data by something more immediately compelling that the medium term potential of the circular economy?
Unfortunately, progress with that challenge also has a precondition. My next post will look at the fact that there’s very little existing data worth sharing…

[…] my previous post – Jump on and hold tight – I shared a MICMAC+ analysis of my systems map for the challenges that face us in […]
LikeLike